02/21/19

Socialisation: More is Better

Socialisation: More is Better

You do not have to read my blog for long to know that I’m a big fan of puppy socialisation. If you read my Puppies 2012 series, you can see the kind of effort I put into puppy raising five years ago (though my methods are different – better – today!).

One of the problems we have with puppy socialisation is that it’s difficult to test the kind of socialisation that works outside of controlled conditions. A recent study used a standardised socialisation program in assistance dogs, and measured the effects. This is a rare opportunity to have a control group for puppy socialisation (as they were all raised in the same conditions in the breeding facility). And the results were fairly impressive!


Study Basis

Undesirable dog behaviours are problematic. Dogs with problem behaviours may be surrendered to rescue. If they occur in specialised breeding programs (like assistance animals, working animals, or sport animals), then dogs that have unsuitable behaviours are the financial burden of wastage. In the worst case scenario, a dog that is aggressive to people or other animals can cause physical and psychological harms.

In many animals, including dogs, we know that juvenile experiences affect development. Puppyhood may be the time to save adult dogs. For dogs, we know that the crucial social development period is 2-13 weeks of age.

Studies on puppies have suggested that early socialisation causes puppies to:

  • Mature faster
  • Explore more
  • Be more resilient
  • Perform better on problem-solving task
  • Be more successful in training

But there is a paucity in dog research. Many studies only look on the short-term impact on puppy development, and do not look at particular socialisation programs. This study wanted to address this paucity.


Study Design

In this study, an assistance dog puppy-raising facility was used. This meant the puppies could be raised in a controlled way. This study used puppies that were golden retrievers, labrador retrievers, or mixes of.

The control group had fourteen puppies who received the centre’s ‘standard’ socialsiation program.

The study group included nineteen puppies who received the standard socialisation program plus ‘extra’ socialisation 5-7 days a week. This extra program took 5 min per puppy in weeks 1-2, 10 minutes per puppy in weeks 3-4, and 15 minutes per puppy in weeks 5-6.

This socialisation program was tailored to the development of the puppies. For example, there’s no point opening and closing an umbrella around a 10 day old puppy. Basically, the socialisation was specific to that age group’s comprehension, and also layered in a way that meant that it wasn’t overwhelming – just appropriate.

It was also important that the program was effective, quick and easy, and low cost.

Below is the programs that the ‘standard socialisation’ and ‘extra socialisation’ puppies were exposed to. It’s actually a little more complicated than this, as there is specific ages that this stimuli should be experienced by the pups, but I went for this simplified version. You can pursue the full text if you really want to know!

Tactile:
-Puppy picked up
-Puppy stroked gently with fingers
-Handle each puppy in the kennel with bitch
-Groom in kennel
The above is standard. Extra in ES is:
-Wearing velcro collar
-Body touched specifically: head, body, tail, legs, paws
-Holding puppy against: woolen jumper, nylon t-shirt, fleece material
-Stroking puppy with soft towel, rubber glove, soft child’s toothbrush
-Puppy encouraged to move over: carpet, rubber matting, reusable shopping bag

Auditory:
-Radio on in the kennel block
-Washing machine sounds
-Plastic bottle with dried pasta inside in kennel with litter
The above is standard. Extra in ES is:
-Sounding near the puppy: a paper bag, a plastic bag, jangling keys, ringing mobile phone, clapping
-Rolling noisy items (e.g. filled toy) in the pen and outside of the pen

Visual:
-Television on in the kennel block
-Push chair in visual range of kennel
-Charity collection box in visual range of the kennel
The above is standard. Extra in ES is:
-Puppy put in front of TV
-Rolling items in and out of the pen
-Hanging items above the stimulation area
-Opening and closing an umbrella
-A mirror (and encouraging exploration of)

Interaction with People:
-Puppy weighed
-Puppy nails clipped
-Puppy carried around block
-Contact with people wearing dress up clothes
-“At least two sessions in a socialisation kennel as a litter”
-Time away from litter
-Grooming on grooming table
The above is standard. Extra ES is:
-Puppy carried around kennel or to socialisation kennel
-Puppy stroked by hand
-Puppy’s teeth and ears examined
-One on one play session for 3 minutes
-Puppy gently restrained for 5-20 seconds
-People wears hat, sun glasses, back pack

Interaction with Environment:
-Empty plastic bottle in kennel with litter
-Toys in kennel to include: soft, plastic, squeaky, rubber, big soft toy
-At least two session on rubber and grass outside areas (that is at least four sessions outside
-Cardboard box in kennel
-Tunnel in kennel
The above is standard. Extra ES is:
-Experience concrete, grass, and rubber surfaces outside
-Puppy encouraged to climb over an obstacle
-Puppy encouraged to move in and out of door ways
-Gently place a towel over puppy and let it find its way out

Then, at six weeks of age and at eight months of age, the puppies were assessed.

At six weeks, the puppies were exposed to six stimuli, and puppy responses were scored on a seven-point scale. It is most desirable for them to get a score of four – but low scores are least desirable. The same trained staff member assessed all puppies, and did so blind (i.e. did not know which puppy was from which program).

Then, at eight weeks, the puppy’s handler was asked to complete a questionnaire of 40 questions, using a bar scale of 0-100. In this tool, low scores were most desirable, except for the trait of trainability. The puppy handler was also blind (i.e. did not know what program their puppy was from).


Study results

We could simply say: it worked. This small amount of extra socialisation resulted in better dogs, at least until 8 months of age.

“This is the first socialisation program tailored to the developmental stage of puppies from birth to six weeks of age to demonstrate measurable, long-term effects on individual dog behavioural traits.”

At all stages of testing (6 weeks, 8 weeks, and 8 months), the puppies who were on the extra socialisation program did better.

Puppies on the extra socialisation program scored better on:

  • Separation related behaviours,
  • General anxiety scores,
  • Body sensitivity scores, and
  • Distraction.

Additionally, extra socialisation puppies showed more desirable attachment, excitability, and animal chase scores (but this was not statistically significant). There was no affect on trainability or energy scores.

On the Puppy Profiling Assessment (where the perfect score is 4), puppies in the standard socialisation program had a mean score of 3.1, while the ones on the extra socialisation program had a mean score of 3.8.

A puppy exposed to things at a young age is likely, as an adult dog, to treat those things as benign. This reduction in novelty logically affects how dogs behave – they are less anxious and distracted by stuff they’ve seen before.


So what should we do? 

To quote the article, “The program is recommended for working dog [including assistant dogs], pet dog breeders and shelters.” This really says what we always knew - everyone breeding dogs should be socialising their puppies. This studied showed that what happens before 8 weeks of age affects the puppy throughout at least the first 8 months of life but, presumably, even longer than that.

Ultimately, people are responsible for shaping the experiences of puppies in their care. Arguing that someone ‘doesn’t have time’ to raise puppies well is illogical, according to this study. The puppies on the extra socialisation program did not receive a great deal more time with people, it’s just the way that time was utilised that varied.

For working dogs, early experiences are particularly relevant due to expense and wastage that results from failure in socialisation – and those working dogs raised in kennel environments are at greater risk again.

This study suggests the extra socialisation puppies spent more time away from their littermates which may also result in these bettered scores. Perhaps this time away from their family for small bouts meant they developed better ways of coping with the stress of permanent separation at 8 weeks.

Regardless, we know that socialisation matters, and more is better!

“Mildly stressful early life experience and challenging situations make animals more resilient to stress, less susceptible to emotional disturbances, and promote motor and cognitive skills in adulthood.”


My Thoughts

This study has a relatively small sample – there are only 33 puppies across the two groups. We need to see this study replicated with larger groups in order to make definitive conclusions.

This study has also put a lot of emphasis on appropriate age of exposure. In a clinical or kennel environment, then this formulaic approach to puppy socialisation is understandable. In more naturalistic settings (i.e. home puppy raisers), I don’t think it’s too important to get fussy about what exactly the puppy is getting exposed to at what age, as long as the puppy is not scared and not oblivious to the stimuli.

The big take home point are: socialisation matters, and it can just take 5-15 minutes a day with a puppy to make a difference to the future adult dog.


Further Reading

This study has also been reviewed by:

Giving Puppies Extra Socialization is Beneficial to Them from Psychology Today

Extra Early Socialization for Puppies Makes a Big Difference from Companion Animal Psychology


Source

Vaterlaws-Whiteside, H & Hartmann, A 2017, ‘Improving puppy behaviour using a new standardised socialisation program’, Applied Animal Behaviour Science, vol 197.


Other Blog Posts

Puppy Socialisation Checklist

Television is Good for Puppies

Puppy Socialisation by Dunbar

Socialisation – Not Everything

08/17/17
dog bites who gets bitten by which dogs

Which people get bitten by which dogs?

dog bites who gets bitten by which dogs

Dog bites are one of my niche areas of interest, so I when I came across this 2008 bite study, I was keen to read. The overall objective of this study was to work out the similarities between biting dogs and people injured by them, to be able to understand dog bites in such a way that public health could be influenced.

And dog bites are a bit public health problem. In 1986, dog bites were among the top 12 causes of nonfatal injury in the US. in 2005, an estimated 800 000 dog bites needed medical attention in the US. On average, 18 people die per year in the US as a result of dog bites. The number of reported dog bites is going up each year, suggesting this is a growing problem. (Though, personally, I think the number is probably going up to growing intolerance of dog bites in the community.)

So this study was a retrospective cohort study, looking at data for incidents that occurred in the 2002/2003 financial year in Multonomah County, Oregon. In this study period, 636 dog bites were reported to Animal Control Services, while there were 47, 526 dogs licensed in the county.

What followed was a whole lot of number crunching that I don’t entirely understand. From where I’m sitting, it looks like a fair bit of extrapolation went into the figures seen below, but without sampling every single household for dogs and other aspects, I’m not sure if there’s a much better way to go about it.

But regardless, onto the results…

The Biters

From this study, dogs were more likely to bite if:

  • They were of particular types (terrier, working, herding, and nonsporting),
  • They were sexually intact and male, and
  • They were purebred.

Instead of using dog breed, they used dog type, to try to avoid problems in identification. (For example, the general public has a hard time determining between a border collie and coolie, but they do know it’s some kind of herding dog.) The breeds listed above were more likely to bite than dogs that were sporting breeds, hounds, non-AKC breeds, and toy breeds. This study suggested that the dogs in the ‘problematic’ groups have instincts they’re likely to revert to if left untrained (which doesn’t ring true to me for the nonsporting group), and threat they are a ‘size and strength’ to cause damage (which doesn’t seem right considering the size of most terriers).

More intact male dogs bit than any other neuter/sex ratio. This is different to other studies I’ve reviewed.

It’s really perplexing that purebred dogs were more likely to bite in this study. I guess this goes to the breeding practices, but it’s curious to think that crossbreed dogs, presumably bred by people who are ‘accidental’ breeders, end up with less-bitey temperaments. Something for breeders to think about. While these dog factors existed, there was also a range of other elements to a dog bite.

“Factors that determine whether a dog-human interaction will result in a bite are complex and involve characteristics of the dog, the injured person, the owner, and the dog’s environment.”

The Owners of the Biters

Biting dogs were more likely than nonbiting dogs to live in neighbourhoods where the residents’ median incomes were less than the county median income value. If controlling for breed category and controlling for sex, “dogs living in census block groups that had incomes less than the county median were 1.5 times as likely to be reported as a biting dog than reported as a nonbiting dog”. When dog owner data was compared to population density, percentage sex by age, percentage nonwhite race, and percentage without high school diploma, there was still not an association with biting. It was correlated just with income!

So what’s going on here? What’s different in areas were less income? Less money spent on training? On fences? Different attitudes towards child raising? This study suggests that people in these areas may be inclined to select particular breeds (i.e. especially those with reputations for aggressive behaviours). (Though this study didn’t look at whether some breeds were more likely to be owned by different groups.) They also suggest that low income areas may socialise their dogs in a different way, and therefore change the bite potential of the dog, or perhaps they’re not trained or supervised in a way that minimises dog bite risk.

“In another study examining dog bite injuries in St Louis, Mo, bite injuries occurring in low income areas were attributed to large numbers of children playing outdoors, few homes with adequate fencing, poor dog control, and a high proportion of large-breed dogs owned for protective purposes.”

As a personal comment, in my experience, crossbreed large dogs are cheaper than small dogs or purebred dogs. This means low income areas are likely to own bigger dogs, and we know bigger dogs are more likely to have their bites reported. While studies of the past have looked at breed and sex-neuter status, this study reveals a new area for further research: block group income levels.

But there’s more: It’s not just about the dog and who owns it, but also where the bite took place.

The Place of the Bites

Dog bites occurred:

  • 35.1% of bites happened in the dog’s home or yard.
  • 23.4% of bites happened in ‘neutral territory’
  • 17% of bites happened in dog/victim household (i.e. the parties lived together)
  • 10.1% of bites happened in household of victim (not dog’s place)
  • 7.1% bites unknown place
  • 3.8% at “place of employment” – e.g. vet clinic, rooming facility, MCAC
  • 3.6% “Neighbour’s Property” (which could be grouped with the 35.1%)

This reinstates the idea that parents need to be extra vigilant when they are visiting houses with dogs.

Other Statistics

Other tid bits of interest:

  • Boys and girls aged 5-9 years had highest rate of injury, boys a bit higher (but not significantly so).
  • Of the 636 biting dogs, 49% had a license number. There are some estimates that less than half of all dogs are registered. (I really wonder what this kind of statistic would look like in Australia.)
  • 36% of dog bite victims didn’t know the dog that bit them. (The largest portion.)
  • But: Among children, 46% were bitten by the family dog.
  • More dog bites in summer months.
  • No significant difference between male and females being bitten.

Limitations

Like all studies, there are a number of problems. In this study, the results are limited by.

  • Not all dog bites will be reported. Dog bites are a reportable incident in Oregon, but the records are incomplete. There’s a problem with recording of dog bites. A previous study, referenced in this one, suggested that only 17% of bites are reported to any authority. (And while this may be the case, how else should we be analysing dog bites except through dog bite records? This model is probably the best we have.)
  • We know members of the public are not very good at reporting dog bites by breeds.
  • Dog license data can only be used as an estimate of breed-populations – especially because we know perhaps only half of all dogs are registered. Further, if owners of some breeds are less likely to license their dogs, the breed specific bite rates are further skewed.
  • When a large-breed bites, that bite is more likely to be reported and more likely to need medical care, meaning that there is a reporting bias that can increase the number of these dogs seemingly involved in incidents.


Conclusion

This study made recommendations for reducing dog bites:

  • Combined approaches from human medical communities, veterinary communities, and animal control to help foster healthy relationships between people and pets.
  • Focus on low income neighbourhoods.
  • Paediatricians to counsel parents (dog owning and not) on dog safety during routine medical visits.
  • Low cost spay neuter.
  • Education programs (perhaps through animal control).

“Innate tendencies dictated by breed, sex-neuter status, and size play a role in the potential of a dog to bite, but owners are ultimately responsible for their dogs’ action[,]… and need to make every effort to minimisze their dogs’ bite potential through obedience training; neutering; and supervision, especially around children.”

Source:

Shuler, CM, DeBess, EE, Lapidus, JA, and Hedberg, K 2008, “Canine and human factors related to dog bite injuries”, JAVMA, vol 232, no 4.

07/16/17
Litter Size - Can we predict it?

Litter Size – What the research says

Litter Size - Can we predict it?

There is an ongoing paucity in the literature surrounding most dog matters, and that means dog knowledge is often based on anecdotes and experience instead of facts and figures. Dog breeding is no exception. Breeders will tell you that they get bigger litters if x, smaller litters if y, that they’ll never mate a bitch if z. While personal experiences can provide case studies, I am interested in much bigger data.

Enter a Norwegian study looking at 10,810 litters.

This study used data held by the Norwegian Kennel Club to look at every litter registered in 2006 and 2007, across 224 breeds. Statistical analysis was then done to determine all the wonderful figures summarised below.

The aim of this study was to determine what actually makes a difference in litter size. (Litter size being the number of puppies born, alive or dead.)

Firstly, an overall average had to be determined. For this data set, the average litter size, considering all breeds, was 5.4 puppies.

For those interested in average litter size by breed: The largest average litter size was in the Rhodesian Ridgeback with an average of 8.9 pups per litter. The Toy Poodle and Pomeranian had the smallest average litter size – 2.4 pups per litter. And the Border Terrier (because I’m biased) had an average litter size of 5.1 pups per litter.

This study found that litter size was influenced by the size of the breed, the method of mating, and the age of the bitch. Litter size was not affected by season of birth, or the number of litters a bitch had had.

Size of the breed

This study examined dogs based on average breed size. They were classed as miniature breeds (<5kgs), small breeds (5-10kgs), medium breeds (10-25kgs), large breeds (25-45kgs), and giant breeds (>45kgs). Bitches were recorded against the average size of a dog for their breed and not specifically on the size of that given bitch.

“When looking at all the … litters…, mean litter size increased with the size of the breed. The mean litter size was 3.5 in miniature breeds, 4.2 in small breeds, 5.7 in medium breeds, 6.9 in large breeds, and 7.1 in giant breeds.”

The feature of larger dog breeds having larger litters is not a new thing – this phenomena is consistent across other studies. But this study is different as it found that it wasn’t just size of the breed that mattered…

Age of the bitch

The first analysis of this data showed no significance with the age of the bitch, however, once breed size was taken into account, there were two trends apparent:

  • In small and miniature dogs, young and old bitches had smaller litters than the ages in between.
  • In larger breeds, increasing age corresponded with decreasing litter size. (Young bitches of larger breeds produced the largest litters – unlike small and miniature breeds.)

Predicted litter size by the age of the bitch for the five different breed size groups from Borge et al. study.
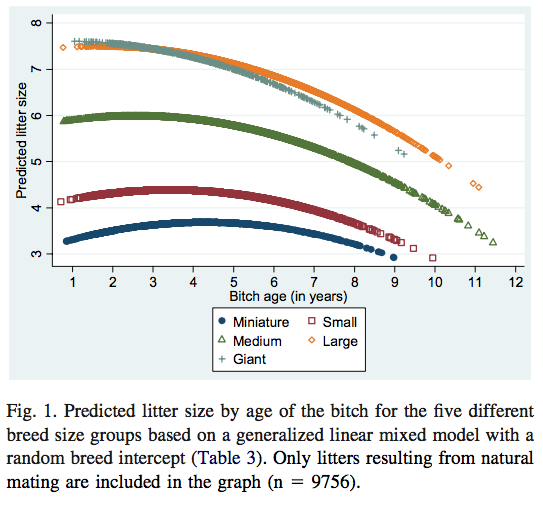
These results are a little different to other studies, which have shown smaller litter sizes as bitches get older. (As in, the results this study got for larger breeds was seen in all breeds in previous studies.) It could be that smaller sample sizes in other studies may have missed this, or that other studies used larger breeds as their data set instead of small or miniature breeds. One suggestion is that small breeds may not mature as quickly as previously believed, and so they’re not able to reproduce until they reach that mark. (To me, this kind of makes sense – considering small breeds often live longer, then it’s likely that they mature more slowly, too.)

Method of mating

Like the age of the bitch, the first analysis on the data didn’t show a significance change in litter size based on mating method. However, when the data set was adjusted for breed, breed size, and age, naturally mated bitches had significantly larger litters than those who had been AIed (either fresh or frozen).

A decrease in mean litter size of 0.4 puppies would be expected for litters conceived with AI with fresh semen and 1.3 for AI with frozen semen, both compared to natural mating.

Things that didn’t matter

The number of litters a bitch had previously didn’t influence the size of her litter. (However, older bitches normally had had more litters – and their age did influence litter size.)

The season the litter was born in did not influence litter size.

Conclusion

Size of the breed, age of the bitch, and the method of mating are three factors that work together in determining litter size. It’s not one thing – it’s all three.

“… the size of the breed, the age of the bitch and the method of mating were found to influence litter size in purebred dogs when controlling for breed, with the size of the breed as the strongest determinant.”

This study is better than past studies in this area for its huge sample size, its variety of breeds, and the fact that it considers all puppies in a litter (not just those registered, as some past studies have done). In this way this study is unique. It is probably a pretty reliable data pool for purebred dogs, too, as 90% of purebred dogs in Norway are registered with their kennel club.

Things to consider regarding the vigour of the results:

  • It’s a retrospective study.
  • It does not include data from litters where all pups were born dead.
  • Calculating mean litter size is hard, because of the percentage made up of small or large breeds. Small breeds are currently popular, so could perhaps pull down the mean litter size seen in this study. Studies done in different countries, with different breeds being popular, are likely to result in different results.
  • There is a relatively small sample of bitches who were mated not-naturally in this study, so the results of assisted breedings should be interpreted cautiously, however the results are consistent with previous findings.
  • This study only groups dogs by weight – not by body shape. This might yield differences. (A neapolitan mastiff is really different to a greyhound.) And they group them by weight average of breed, not the weight of the individual bitch
  • This study looked at only two years and the researchers wonder if there might have been more variation in season of birth if there was more time taken into consideration.

In conclusion: Based on this study, breed size is the strongest determinant for litter size in a dog. The age of the bitch and the method of mating were also significant predictors of litter size. These three things interact, making litter size predictions difficult!

Acknowledgements:

Borge, KS, Tonnessen, R, Nodtvedt, A, & Indrebo, A 2011, “Litter size at birth in purebred dogs – A retrospective study of 224 Breeds”, Theriogenology, 75, 911-919.

Thank-you to Waldwiese Kennels for the cover image – a litter of longhair weimaraner puppies.

03/1/16

Eat Less, Live Longer

Eat less, live longer


ResearchBlogging.orgLast year I went to a Primal Paws workshop in Adelaide, and Dr Jamie mentioned research which suggested that dogs that stayed skinnier lived longer healthier lives. Obviously, I had to know more, so I found the 2002 paper on Labradors.

Young Black LabradorThe basic design of this study (published in 2002) involved 48 labradors. Each labrador was buddied with another labrador at 6 weeks of age (choosing a buddy based on sex and body weight), and then one pup in the pair was fed 25% less than the other dog in the pair throughout life.

The focus on his study was basically to see the effect that 25% less food had on longevity and other illnesses in dogs. Apparently, many other studies have been done, primarily on rodents, that have shown that less food (regardless of many other variables) results in longer living and healthier animals. However, this research hasn’t been conducted on larger mammals. (This is the first study, that the authors know of, on dogs. Research on primates is ongoing.)

Each year, for at least 14 years, the dogs alive had bloods taken and body composition scoring. Also, their deaths and any diseases that occurred were recorded alongside the year of acquisition.


The main points:

  • Dogs that had less food’s median life span was significantly longer.
    Dogs who were fed less had a median lifespan of 13 years, compared to 11.2 years in their partners.

  • “The onset of clinical signs of chronic disease generally was delayed for food-restricted dogs.”
    For dogs who had oestoarthritis (which was 43/48 dogs), 43 of these dogs required treatment. For controlled fed dogs, first treatment was needed from 6.8 years to 12.9 years. In the restricted fed group, first treatments was needed from 7.9 years to 14.1 years. Mean age was 10.3 in controlled group and 13.3 in restricted group, which was statistically significant.
    39 dogs required treatment for 1 or more chronic conditions. “Mean age to which 50% of the dogs in each group survived without requiring treatment for a chronic conditions as significantly lower for the controlled-feeding group than for the restricted-feeding group.”

  • ”No signs of nutritional deficiency (eg, progressive weight loss and general or specific clinical signs of a nutrient deficit) occurred during the study.”
    It’s important to note that, even though 24 dogs were fed a lot less food, they were still healthy!

  • Dogs in both groups had increased body condition scores (i.e. were fatter) from 6-12 years.
    This is just an interesting tidbit that illustrates a lull in the body’s metabolism at this particular point of time.


Problems

It’s hard to know whether this study will be replicable in different breeds or different genetic stock. Considering the history in the duplicity of results in other species, I think we can be pretty confident these results are solid. However, more research does this would be great.

Even though 48 dogs is a pretty good number for a sample, a bigger sample size is always better.

One question I found myself asking throughout this is, if it’s better to feed less food of a higher quality to maintain weight, instead of more food of poor quality? This would also be a good area for further research.

Indi mourns over the understanding that it's better for her to have 25% fewer chips.

Roxy mourns over the understanding that it’s better for her to have 25% fewer chips.


Take home points:

  • Feed your dog less. It might live longer.
  • Feed your dog less. It might be longer before it needs treatment for oestoarthritis (if they develop the condition).
  • Feed your dog less. It might be longer before it needs treatment for any chronic condition.
  • Feed your dog less, especially once he turns 6 years old.
  • Point from the actual text: “We recommend that for purposes of health and longevity, dogs be fed to maintain a body condition score less than 5.”

I’ve never been happier with my decision to keep my dogs at a lean weight throughout life.


Reference:

Kealy RD, Lawler DF, Ballam JM, Mantz SL, Biery DN, Greeley EH, Lust G, Segre M, Smith GK, & Stowe HD (2002). Effects of diet restriction on life span and age-related changes in dogs. Journal of the American Veterinary Medical Association, 220 (9), 1315-20 PMID: 11991408


Further reading:

How to Reduce Your Dog’s Weight

02/24/16

CECS is a Gluten Sensitivity

The idea that CECS is a Gluten Sensitivity has been presented by recent research.

They were actually quite confident with the link between the two, saying in the research,

Canine epileptic cramping syndrome in [border terriers]s is a gluten-sensitive movement disorder triggered and perpetuated by gluten and thus responsive to a gluten-free diet.

This is pretty exciting stuff! CECS (short for Canine Epileptoid Cramping Syndrome, or sometimes called ‘Spike’s Disease’)  is an unusual condition found almost exclusively in border terriers. These dogs are normal dogs except for when they have an ‘episode’ or a seizure. During an episode, the dog will ‘cramp up’. Typically, they remain conscious, but can’t walk, and sometimes appear worried following an episode.

Chip, a border terrier that does not have CECS

Chip, a border terrier that does not have CECS

So far, there has been no real diagnostic test or explanation for the condition. In December 2013, a study looked at CECS, but it was an owner-survey, information-gaining exercise. Which is important, but doesn’t give us answers!

It was so important that it actually spurred this research. In the December 2013 study, 50% of dogs were found to ‘respond’ (i.e. have less episodes) on a gluten-free or hypoallergenic diet.

So now let’s welcome this lovely small study titled ‘The Clinical and Serological Effect of a Gluten Free Diet in Border Terriers with Canine Epileptoid Cramping Syndrome‘, which begins to look at how we can both diagnose and treat CECS. Exciting stuff!

The aim of the study was to work out if a gluten-free diet would effect dogs with CECS. Not only did the researchers want to know if the dogs stopped having episodes, but if their blood looked different with and without gluten. Naturally, they wanted to know if these things were correlated.

The dogs involved were 6 border terriers (an equal mix of male and female). Each dog:

  • Had had CECS for at least 6 months
  • Had been diagnosed with CECS via veterinary observation (including video)
  • Had had at least 2 CECS episodes
  • Had not tried gluten-free diets before

For interest sake, the average age of onset for CECS in this small sample was 2.6 years.

Winnie, another border terrier who does not have CECS

Winnie, another border terrier who does not have CECS

Once recruited, the dogs had blood taken and the owners were given instructions for the dog going on a total gluten-free diet (Hypoallergenic Canine Dry from Royal Canin). The dog underwent a general physical examine (and some dogs went through more intensive procedures, owners consenting) and all were determined to be healthy, beyond the presentation of CECS.

The blood was again taken at 3, 6, and 9 month periods.

The blood was tested for antibodies which are considered important in diagnosing gluten sensitivity in humans.

The blood of non-CECS border terriers was also taken and tested.

The owner was asked to keep a record of the incidents of CECS in their borders.

Are you ready for the results? They’re pretty compelling.

So all that changed in these border terriers’ lives was that they were put on a completely gluten free diet. With this one change, all of the borders terriers, when they adhered to the gluten free diet, stopped having seizures within 4 weeks. Three dogs did not have seizures at all once they started the diet.

Two dog owners, upon completion of the trial, accidentally fed their dogs treats with gluten… And the dogs had seizures again. So not only did a gluten free diet stop seizures, the reintroduction of gluten caused seizures.

Now let’s talk about “Dog 6″. Dog 6′s owner is the epitome of why these kind of studies, where dogs are left with their owners, are hard work! Throughout the study, Dog 6 was a dog that continued to have seizures. Dog 6′s owner presumably fed the dog the gluten free diet, but then allowed the dog to continue to graze on horse poo when out and about.  This issue wasn’t identified until late in the study and so Dog 6 was excluded from the serum results listed in this article. However, when Dog 6′s owner actually did was they were told and stopped the horse poo eating, Dog 6 stopped having seizures too! When Dog 6′s blood was tested 3 months after the study ended (but 3 months into the owner actually doing it right), that dog’s blood results was consistent with the other dogs, and it too had ceased having episodes.

Why is this study such a big deal?

Up until now, we have had no way to diagnose nor treat CECS. (In fact, one of the criteria established in the 2013 study of CECS indicated that if a dog fails to respond to epilepsy medication then it probably is CECS. Nice to know, but not a great deal of help.)

The blood results from these dogs showed high levels of relevant antibodies in affected dogs while they consumed a diet with gluten. The presence of gluten-associated antibodies could be used to diagnose CECS.

Clearly, a treatment has been identified too: avoid gluten!

Other areas that are of interest:

  • Signs of gastrointestinal upsets could be a sign of gluten problems, or of future CECS. Vomiting, soft stools, or belly grumbling was reported in 2 of the dogs featured in this study. The presentation of belly problems and CECS together can be an indication of just one problem – gluten sensitivity!
  • The story of ‘Dog 6′, to me, really shows the importance of owners in being vigilant. I feel that many dog owners take a rather lazy approach to food elimination diets, but elimination means to completely remove. If you don’t completely remove, you can’t say that it’s been tried!
  • In humans, celiac disease has sometimes been associated with a rash… Which makes me think back to the correlation between CECS and skin-conditions in borders identified in the 2013 study.

Another quote from the study:

These investigations support the hypothesis that CECS is a manifestation of gluten sensitivity, making this the first [sudden onset] movement disorder in veterinary medicine with a serological link to gluten.

What research from here?

This is a very small study, and it’s important that we do more research before making solid conclusions. This study itself suggests further research:

  • With a larger sample size
  • More research into the correlation of gastrointestinal upsets and CECS
  • A double-blind randomised placebo-controlled trial

But in the meantime, while we’re waiting to know more, these researchers (and I!) recommend that, if you have a border terrier with CECS, you switch the dog to a diet that eliminates all gluten foods.


Reference:

Lowrie M, Garden OA, Hadjivassiliou M, Harvey RJ, Sanders DS, Powell R, & Garosi L (2015). The Clinical and Serological Effect of a Gluten-Free Diet in Border Terriers with Epileptoid Cramping Syndrome. Journal of veterinary internal medicine / American College of Veterinary Internal Medicine, 29 (6), 1564-8 PMID: 26500168


Further reading:

Gluten Sensitivity Triggers Epileptoid Cramping Syndrome in Border Terriers


CECS is a Gluten Sensitivity